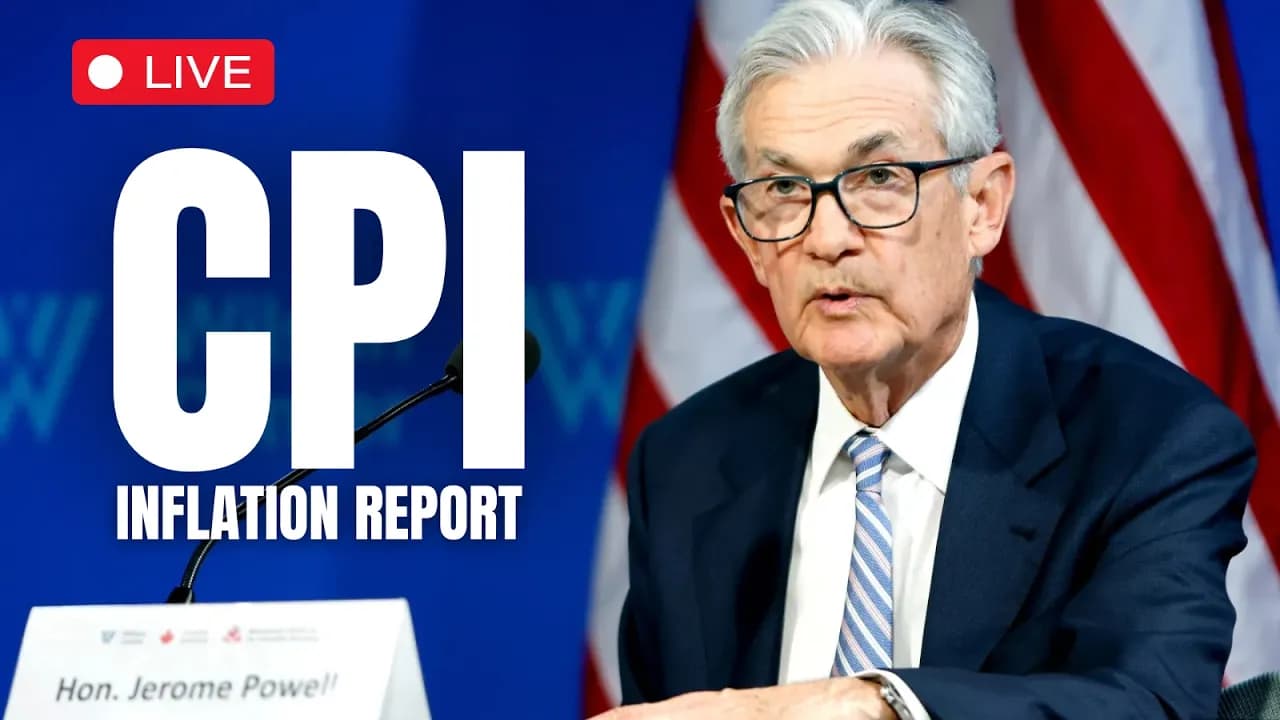
LIVE NOW: CPI DATA INFLATION REPORT MARCH 2026
In a Nutshell
February 2026 CPI rose 0.3% MoM as expected (2.4% YoY), with core CPI at 0.2% MoM; key drivers included fuel oil (+11.1%), food (+0.3%), and shelter (+0.2%), offset by declines in electricity (-0.7%) and used cars. Markets showed muted reaction, with NASDAQ/QQQ consolidating at 613 resistance amid sideways trading and Middle East oil tensions. Lower-than-expected oil prices could ease future inflation; join live trading session for market open.
These notes were generated by AI and may contain inaccuracies.
Good morning. It's Ricky with Tech Solutions. Today is March 11th, 5:26 AM, live for the CPI data report. NASDAQ market is break even in pre-market. Overall CPI expected at 2.4% vs prior 2.4%. Core CPI at 2.5% vs prior 2.5%. Monthly expectation: +0.3% from January's +0.2%. Official site: bls.gov/cpi. Once released, click the PDF for February data. Markets go up if CPI lower than expected (e.g., +0.1% or no change); down if +0.3% or higher.
Join live trading session at market open (1 hour away) via second link in description.
Less than 1 minute left. Markets descending in pre-market: lower highs, lower lows. Report released: CPI +0.3% as expected. Core CPI +0.4%? Markets trying to react positively but indecisive. Giving time for direction: run up or gap down. Delayed response, no strong reaction, possibly due to Middle East events.
Official site: bls.gov/cpi. February PDF: All items for Consumer Price Index for all urban consumers increased 0.3% before seasonal adjustment in February (after +0.2% in January). Over last 12 months: +2.4%. Shelter index rose 0.2%. Energy index rose 0.6%. Core CPI (all items less food and energy): +0.2%.
Indexes that increased: Medicare, apparel, household furnishings and operations, airline fares, education. Expect steep increases in March for airlines and oil prices due to rising tensions (started in February with Iran).
Line items tracked month-over-month (Jan to Feb):
- Food: +0.3%
- Food at home: +0.4%
- Energy commodities: gasoline, fuel oil
- Energy services: electricity, utility (gas) piped services
- Commodities less food and energy: new vehicles, used cars/trucks (decrease), apparel
- Medical care: commodities, services less energy services
- Shelter
- Transportation
- Medical care services
Biggest contributor: fuel oil +11.1%. Electricity: -0.7% decrease. Used cars and trucks: decrease. No change: medical care commodities, new vehicles.
If oil prices drop, inflation report can drop.
NASDAQ tried to push up/down but trading in range, down slightly. Bigger picture: 613 is strong resistance for QQQ (NASDAQ index); similar for S&P 500. Previously rejected here. Lack of progress could lead to another leg down on uncertainty. Not advising sell/panic, but be aware and tolerate if holding. Consolidating at obvious previous resistance.
Not normal muted CPI reaction; usually significant upside/downside move. Markets trading sideways past two months: no upside/downside progress. Uncertainty causes sell-off, then Trump tweet sparks recovery (e.g., this week). Trading in range: good for low volatility, avoids shakeouts. Days of sell-off followed by speedy recoveries keep it ranging.
Market focused on oil, which impacted CPI (fuel oil +11.1%). If Middle East settles, oil drops could gap down monthly oil inflation.
Join live trading session (second link in description). Comment questions or reach via Instagram (linked). Thumbs up, subscribe. End year green.
Keep Ricky Gutierrez in your library
Save the videos and channels worth coming back to, and find them again in one place.