This ALWAYS Happens Before A Stock Market Crash
In a Nutshell
The stock market is in a parabolic meltup phase with S&P 500 valuations (Shiller PE near dot-com peaks, top 10 stocks at 40%) signaling highest risk since 2021, mirroring Japan's 1989 bubble and 1929 crash setups amid declining birth rates, high debt, and circular AI investments. Counterarguments highlight stronger earnings (P/E at 28 vs. 65 in 2001), Magnificent 7 dominance, and poor cash alternatives, with Fidelity noting AI adoption could drive further gains unless cash burn, inter-company ownership, or rising rates trigger collapse. Advice: Stay diversified (US/international stocks + 20% treasuries), dollar-cost average, hold cash for 30-50% crashes, as markets can stay irrational longer than you can stay solvent.
These notes were generated by AI and may contain inaccuracies.
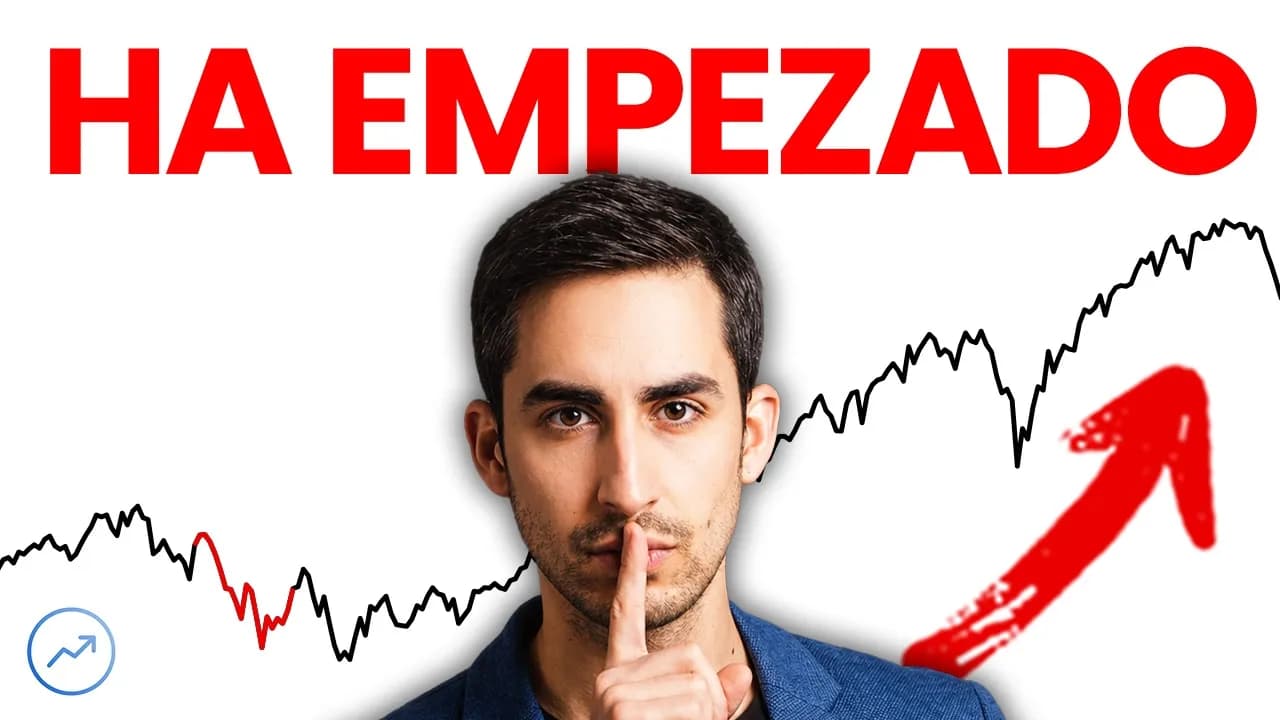
According to Peter Granditch, we are now in the parabolic meltup phase. When and where it peaks is anyone's guess. It's the exit phase, not enter. Better to be a year too early than a day too late. Year-over-year, the S&P 500 is up another 30%. Schiller PE ratios reached its second highest level ever, only slightly behind the dot-com bubble. Concentration peaks show AI near the same point as 2001 tech stocks and the Japanese everything bubble. Risk is the highest it's been since 2021.
Discussing what's going on objectively, what the data says, why risk is highest since 2021, and if we should be concerned. Tired of highly scripted edited videos; preferring laid-back approach. If you appreciate this, hit like, subscribe. Big thank you to Incogn for sponsoring.
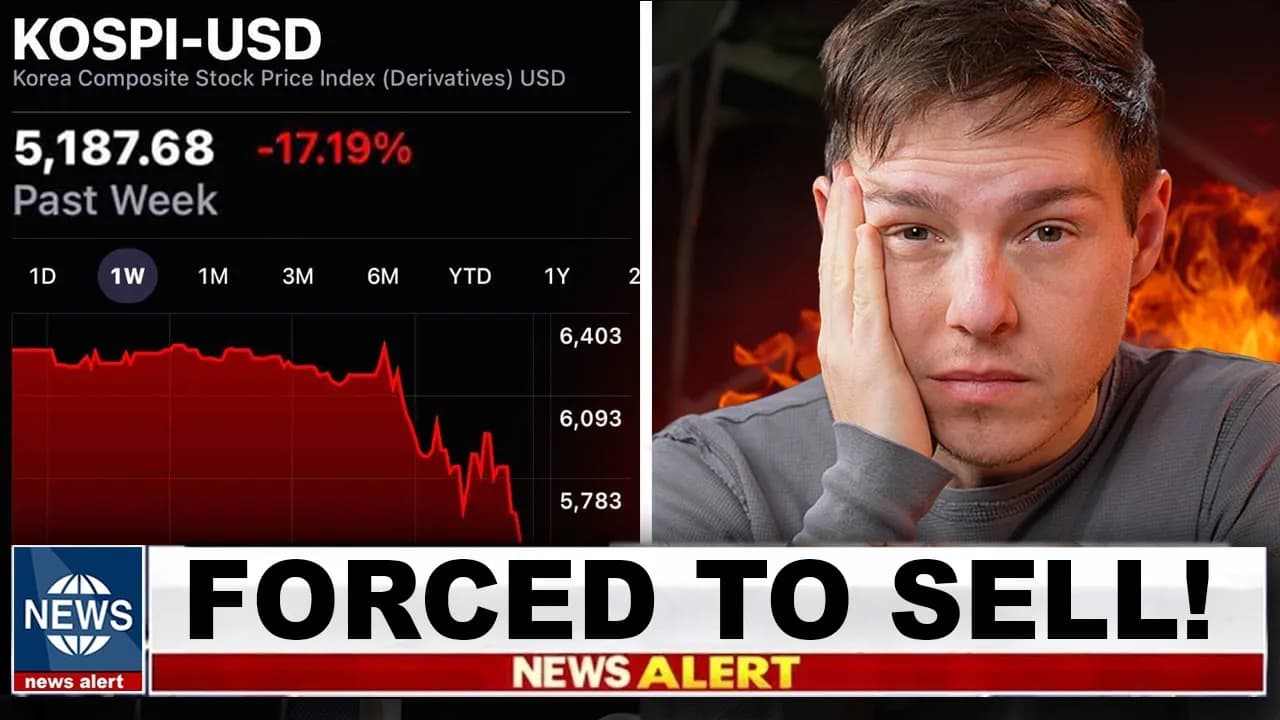
Stock market makes no logical sense. Unresolved conflict in Middle East, gas prices through the roof, everyday living expenses skyrocketing, yet S&P 500 keeps moving higher. Comparisons to United States in 1929 Great Depression. Chart of 1920s blended with last 30 years shows confirmation of final stages of great meltup before crash. Japan everything bubble from 1970-1989: stock market increased >22% a year, turned into one of greatest financial disasters. S&P 500 tracking Japan's path perfectly if updated for today.
Japan's bubble caused by cheap interest rates flooding economy with inexpensive money, leading to more stock market investment, higher land values, borrowing against land to invest more, creating a loop for almost two decades while seen as new normal. In 1989, market fell 50%. Due to shrinking workforce, higher government spending, increasing taxes, economy didn't fully recover for almost 40 years.
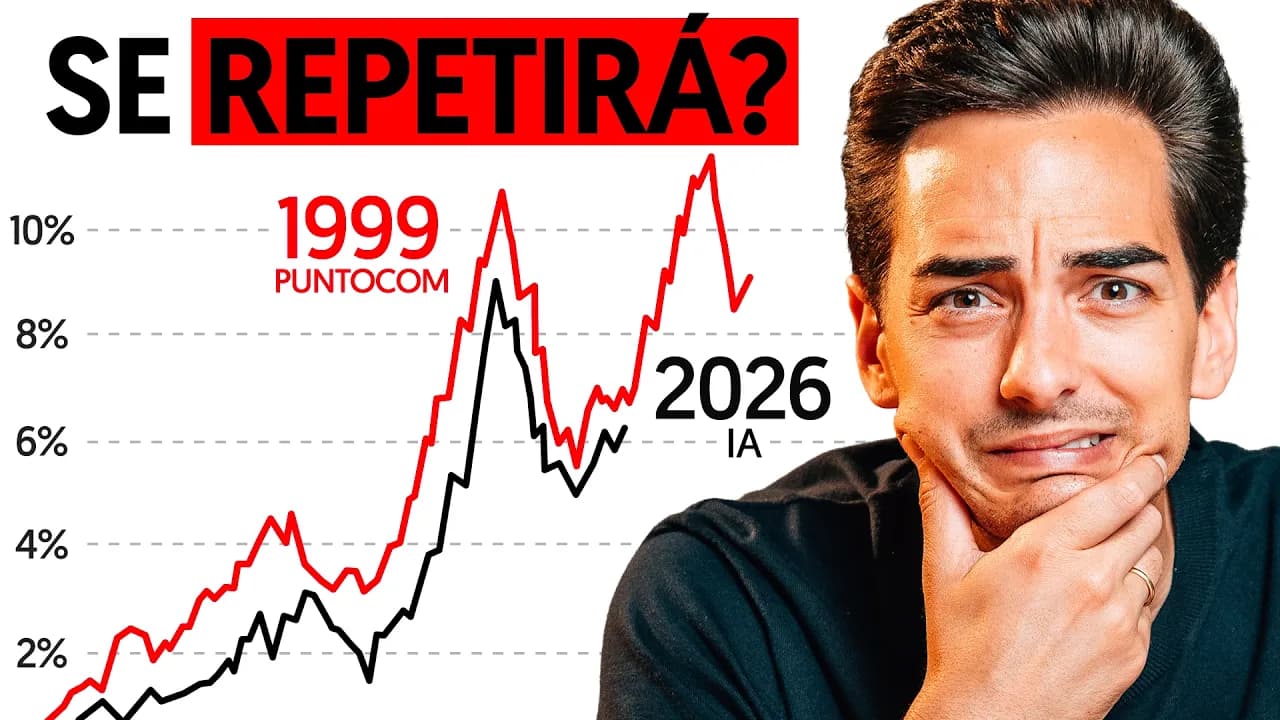
Dot-com bubble: tech stocks fell ~78%. Today back to same CAPE ratio, well beyond historical norm. Buffett indicator at 2.4 deviations above historical trend. Larry Page said he would rather go bankrupt than lose the AI race. Circular investments: every company invested in every other major company. Top 10 stocks make up 40% of S&P 500, exceeding dot-com peak.
Arguments for bubble:
- S&P 500 price-to-earnings forecast exceeds 28, 2/3 higher than 100-year average of ~17. Companies need to make much more money or share prices fall.
- Similarities to Japan: declining birth rate since 1950s, fewer adults having children, rising social program spending. Fewer workers paying into costly system, burden on taxpayers, government raises taxes, detriment to economy. Interest rates must remain low, debt grow faster than economy to avoid stalling.
- Lance Roberts' indicators: decline in organic savings, aging population drawing benefits, heavily indebted economy, unemployment in young people, dependence on productivity increases to offset reduced employment. Economy falsely propped up, fundamentals don't support valuations, must revert to mean, implying stock market fall.
As more money moves online, so does exposure: investments, bank accounts, personal details collected, bought, resold by data brokers. Incogn removes personal data from data brokers, handles objections, conducts repeated removal requests. Create account, grant rights, get updates. Unlimited plan allows custom link removals for exposed info. Use incogn.com/gra, code 'graham' for 60% off annual plan, 30-day risk-free.
Reasons meltup might continue:
- Stocks expensive historically, but companies making more money than during dot-com bubble. Smaller companies catching up, reducing volatility, increasing rally durability.
- Prices don't fall just for being high; need unforeseen risk causing selling cascade. 2022 bull market early on crash timeline chart.
- Earnings strong: companies make and spend a ton vs. 2001. Magnificent 7 (Alphabet, Amazon, Apple, Meta, Microsoft, Nvidia, Tesla) doing incredibly well, boosting US dominance confidence. Fidelity: earnings fantastic, cash flows exceed income, net profits exceed 5-year average, forward earnings below 2001 peak. 2001 average P/E peak 65; today 28.
- Alternatives: holding cash over 50 years averages 0.9% return; last 20 years, -1.8% yearly loss. Choice: guaranteed cash loss or possible short-term stock loss with infinite upside.
Fidelity warning signs to observe:
- Companies burning cash, spending > earnings.
- Businesses owning pieces of each other; one falls, all fall.
- Debt growing out of proportion to profits.
- AI energy limits capping growth.
- Borrowing costs increase → profits decrease.
Fidelity: AI will drive market higher as smaller companies (professional services, industrial, healthcare, utilities) adopt it to scale.
CAPE high, but Ben Carlson: don't use last 150 years; use last 30 years post-internet. Average not as crazy. Margins improving; stocks expensive but earnings will make them fairly priced. Stock market prices future, not today. Analyst: if earnings delivered and political tensions stabilize, equities can move higher.
1929-1949: flat, but investing at peak and holding 20 years still +11% from dividends alone.
Theory: stock market not up, dollar down (M2 money supply). But dollar history: depreciated 2002-2012, appreciated 2010s, while markets fluctuated—no correlation. Fisher Investments: since 1970s (off gold standard), trade-weighted dollar index and S&P 500 correlation only 0.15 (zero). Global stocks up 76% of time regardless of dollar direction. Interest rates, investor enthusiasm matter more than money supply.
For Japan repeat: earnings stall completely, S&P 500 >14,000 to match levels. Currently, market might get more expensive. Bubble talk somewhat priced in. Be cautious: steady income, diversified, enough cash for 30-50% crash. Corrections are long-term buying opportunities.
Market can remain irrational longer than you can remain solvent. Isaac Newton: profited in South Sea bubble 1720, sold thinking unsustainable, watched it rise, rebought near peak, lost everything at bottom.
Personal approach: invest in US and international markets, diversified, 20% in treasuries as sleep-at-night fund. Dollar cost average: listeners over 9 years outperformed market timers.
Like, subscribe. Join channel membership for early videos (no sponsors/ads), bonus content weekly, laid-back unedited videos not algorithm-friendly.
Keep Graham Stephan in your library
Save the videos and channels worth coming back to, and find them again in one place.