It’s actually pretty easy to get ahead of 95% of people financially.
In a Nutshell
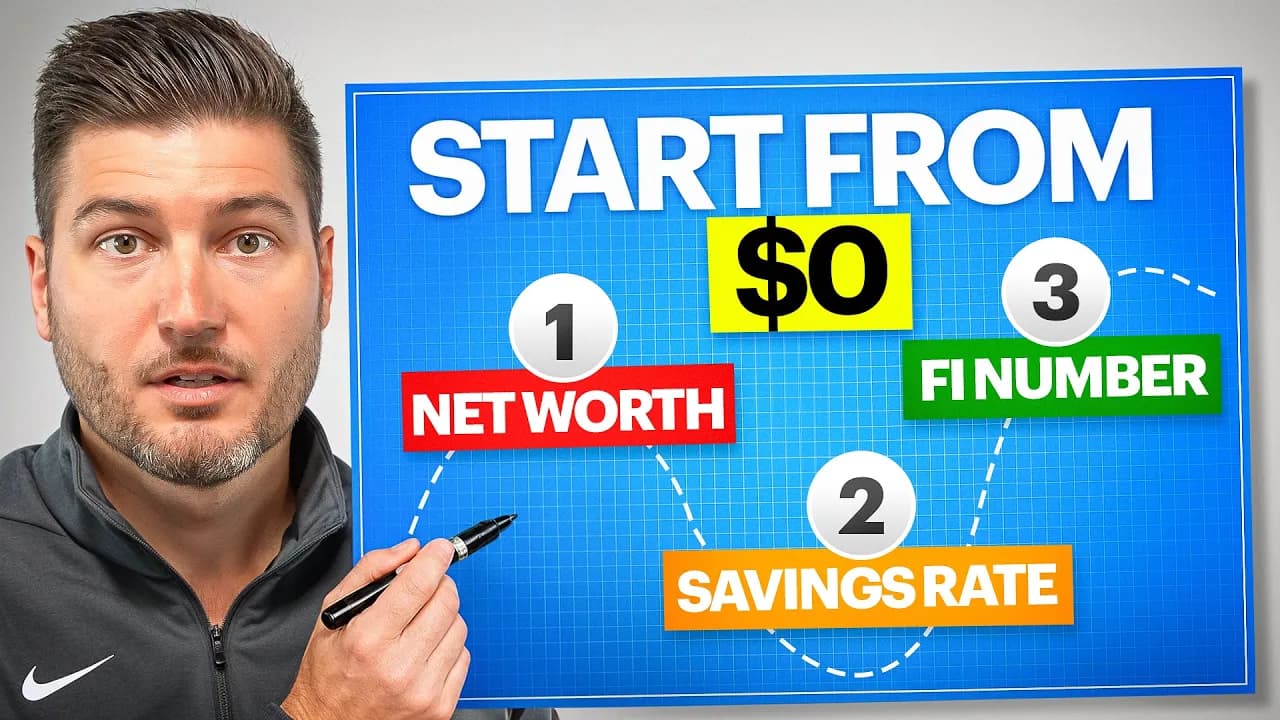
Track five numbers monthly: burn rate (actual spending +15%), total debt with interest rates and payoff timeline, savings rate (automate 5-10% of take-home pay), investment rate (automate 10% into index funds), and housing costs (keep under 30% of net income). Automate transfers to savings and investments before money hits your checking account so decisions are removed. Calculate your crossover point by multiplying annual expenses by 25 to determine the investment total needed for financial independence.
These notes were generated by AI and may contain inaccuracies.
Most people have no idea how much money they spend every month. This blind spot is why most people feel stuck regardless of income. It is not about income or the economy. It is about five key numbers that almost no one tracks. Knowing these numbers puts you ahead of almost everyone else.
Most people think they have a handle on their money but give ballpark estimates when asked how much they spend monthly. When asked about debt, they respond with vague answers like "a decent amount" or "I don't know exactly." When asked when they will be debt-free at their current pace, they give blank stares. These are the most basic facts about financial life, yet almost nobody knows them. People making over $100,000 a year often cannot answer these questions.
Burn rate is the total amount of money spent every single month. It is not a ballpark estimate. When credit card and bank statements are uploaded to AI for analysis, the actual total is typically significantly higher than the guessed amount. The same principle applies to calorie consumption—people underestimate what they actually consume.
To calculate burn rate: log into bank and credit card accounts, pull up the last three months of transactions, add up everything spent each month, divide by three for the average monthly amount, then add 15% to account for expenses that occur in months not captured in the sample (such as car repairs, birthday gifts, or weddings).
Debt is a financial black hole. Most people know they have debt but do not know the exact amount, interest rates, or how long it will take to pay off at the current pace. Without measurement, debt grows. The solution is to list every debt owed, including credit cards, student loans, car loans, and mortgages. Next to each debt, record the interest rate and minimum monthly payment. Then use a debt payoff calculator to determine how long it will take to pay off if only minimum payments are made. At current average credit card APRs of over 20%, some people discover payoff timelines of 20 to 30 years.
Once the real numbers are visible, debt becomes a specific problem with a specific solution. Adding just $100 extra per month to the highest-interest-rate debt can shave years off the payoff timeline. No dramatic lifestyle changes are required.
Everyone knows they should be saving, yet most people wait until the end of the month to save whatever is left, which is typically nothing. Human nature leads people to live up to or beyond their lifestyle. The fix is to pay yourself first by automating savings before the money ever feels available. The target is at least 5 to 10% of take-home pay. If that feels impossible, start with $20 per month to prove to yourself that you are someone who saves. Once automation is in place, the amount can be increased over time. The goal is to build a buffer so that when life happens, decisions are not made with your back against the wall.
Investment rate is the percentage of take-home pay that goes into investments. Most wealthy people are not watching stock tickers or picking individual companies. They set up automatic investments and let time and compounding do the work. $100 per month invested at a 7% real return (after inflation) turns into $247,000 over 40 years. Time in the market is the actual asset, not stock picking or market timing.
For most people, the right approach is boring on purpose: invest in broad-market index funds such as VTI. The target is 10% of take-home pay invested automatically every month. If that level has not been reached, start smaller and increase over time.
The housing ratio is often the hidden source of financial stress. The benchmark most financial planners use is 28% of gross income, but the recommendation here is to stay under 30% of net income, including rent or mortgage plus utilities and all housing-related expenses. Gross income is not the relevant metric because only take-home pay is actually available.
To calculate the ratio: divide total monthly housing costs by net monthly income and multiply by 100. At 30%, management is possible. At 35%, finances start to feel sticky. At 40-45%, money arguments and high stress are likely. If housing is the problem, cutting small expenses like coffee will not solve it.
Wealth-building is not about being smarter; it is about removing decisions entirely through automation. Before the paycheck hits the checking account, the 401(k) contribution is pulled automatically. On the fifth of each month, automatic transfers move money into high-yield savings for the emergency fund and into a Roth IRA. On the seventh, all bills are paid automatically, and the credit card is paid in full. Whatever remains after automation is available to spend guilt-free. After running the system for 3-4 months, a clear picture emerges of how much can be spent freely each month.
The crossover point is the moment when investment income covers monthly expenses completely without needing a paycheck. This is the most important number most people never calculate. It represents financial independence work optional (FIWO)—the ability to continue working if desired but not needing to.
To calculate the crossover point: take monthly expenses (burn rate) and multiply annual expenses by 25 under the 4% rule. For example, $4,000 monthly expenses equals $48,000 annually; 25 times that amount is $1.2 million needed in investments.
On the default path of investing 10% of an $80,000 income at 7% return, the crossover point takes roughly 42 years. Cutting expenses in half reduces the timeline to approximately 13 years. Increasing income by 30% and investing the difference shortens it to 24 years. Doing both brings the timeline to 14 years. The people who reach this point run a consistent system rather than living on nothing.
None of this is complicated, but it is uncomfortable at first. Calculating the real burn rate, seeing total debt in black and white, and determining payoff timelines under minimum payments all create discomfort. That discomfort is necessary to reach the position held by the top 5% financially. A free 7-day roadmap and spreadsheet are available by scanning the QR code or checking the description links. Whiteboardfinanceuniversity.com offers three full courses, weekly live streams, and ongoing accountability for members.
Keep Marko - WhiteBoard Finance in your library
Save the videos and channels worth coming back to, and find them again in one place.