Is It Too Late For Nike? NKE Stock Deep Dive
In a Nutshell
Nike stock has collapsed nearly 80% from its $163 peak and faces worsening fundamentals, executive departures, and removal from the S&P 100, despite still trading at an 18X P/E on declining revenue. Lululemon shows similar technical deterioration but trades at a cheaper 7.9X P/E with 71% upside potential per fair value estimates. The core message: avoid catching falling stocks early—wait for confirmation signals rather than chasing "cheap" valuations that can always get cheaper.
These notes were generated by AI and may contain inaccuracies.
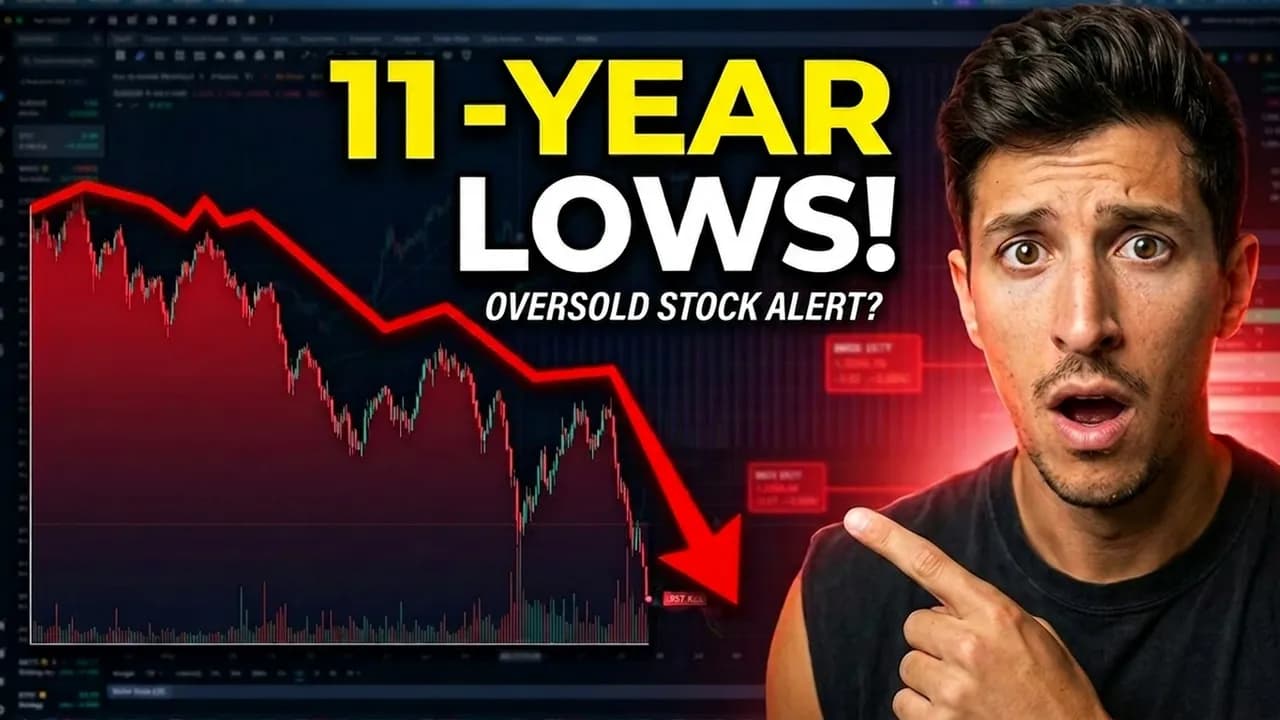
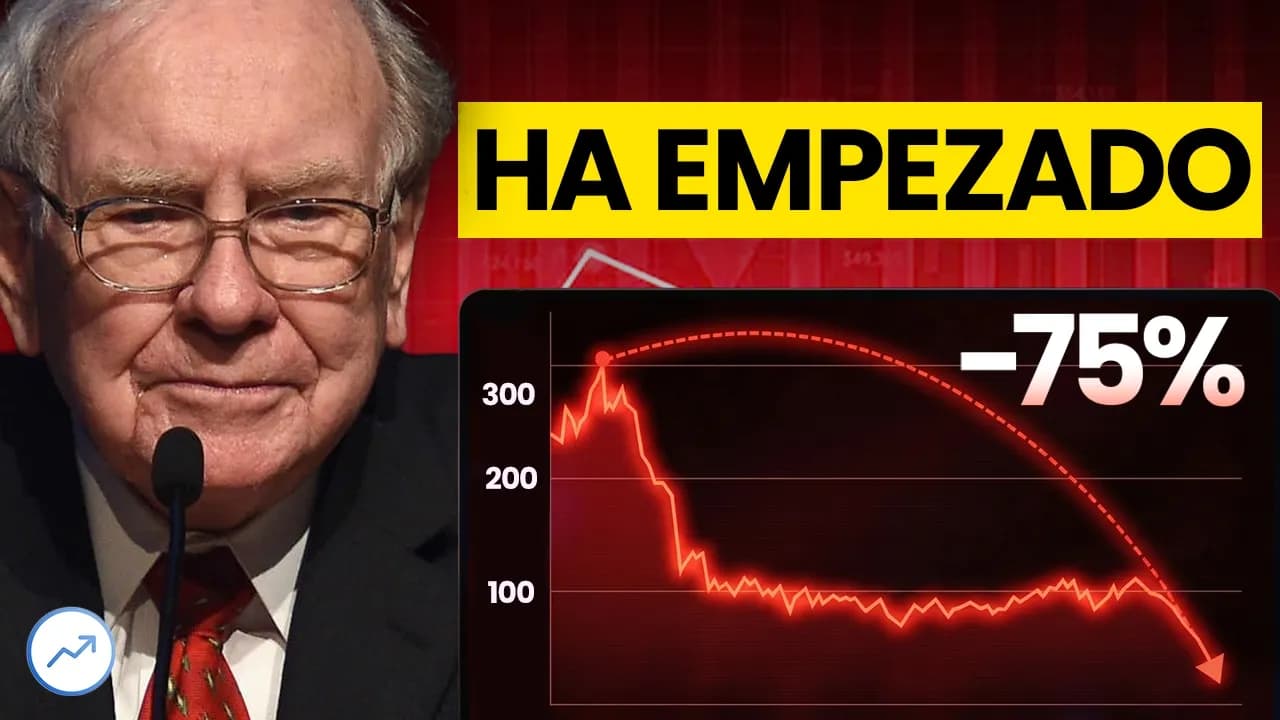
Nike stock hit fresh 52-week lows at $37.70 and is down nearly 80% from its all-time highs of $163 during the post-pandemic rally. The stock experienced a 12-month decline following irrational market levels, with a 50% decline from $163 to lows of $80, followed by lower highs and a descending pattern since then.
Investing Pro analysis shows 46% upside potential to fair value, yet the stock trades at an 18X P/E ratio despite losing 80% of its value. Revenue stands at $46 billion with net income of $3.1 billion, both expected to decline further. Revenue has shown consistent deterioration over recent quarters.
Nike faces multiple headwinds including a series of analyst downgrades and declining revenue from Greater China. The company has seen resignations from key executives including the Chief Accounting Officer (CAO) and Chief Financial Officer (CFO) during a critical period, indicating internal instability.
Nike was removed from the S&P 100 index, with Dell, Palo Alto Networks, and Arista Networks added in its place. This news emerged after hours, potentially impacting Tuesday's market open trading.
Lululemon declined from highs of $120 per share to lows of $96. The stock shows potential technical support at levels last traded in 2015-2017. Investing Pro indicates 71% upside to fair value with a 7.9X P/E ratio, $11 billion in revenue, and $1.4 billion in net income. However, the stock exhibits consistent lower highs and lower lows on the technical chart.
Bloom Energy stock rose from lows of $15 per share to highs of $351 this year, showing significant volatility. The stock is currently testing resistance around the $250 level. Investing Pro shows 52% downside to fair value despite aggressive revenue growth, with the company trading at a 304X P/E ratio. The stock is described as speculative and volatile, requiring careful position sizing without leverage.
The analysis emphasizes avoiding early entry into declining stocks, noting that cheap stocks can always get cheaper. The recommendation is to be late to a rally rather than early to a sell-off, and to wait for confirmation signals before entering positions. FOMO should not drive investment decisions, and investors must evaluate whether current premiums justify potential returns relative to the associated risks.
Keep Ricky Gutierrez in your library
Save the videos and channels worth coming back to, and find them again in one place.