Webinar: Guerra en Irán ¿qué va a pasar con las inversiones?
In a Nutshell
En medio de la tensión por el ultimátum de Trump a Irán, el mercado muestra resiliencia con caídas en tasas y petróleo, subidas en activos de riesgo y metales; el S&P 500 ofrece valoraciones justas (PEG ~1.1), con oportunidades en tech como Nubank, Vista, Nvidia y Mercado Libre por márgenes de seguridad atractivos. Las guerras históricamente generan pisos tempranos en acciones (~10% caída), beneficiando energía y commodities, mientras el oro corrige por tasas altas. Carteras diversificadas del club (60% bonos, metales, emergentes, energía, Bitcoin) superan al 60/40 tradicional en volatilidad baja, Sharpe alto (2.8) y retornos (+31% anual pasado, +5% YTD), priorizando correlaciones bajas y valoraciones.
These notes were generated by AI and may contain inaccuracies.
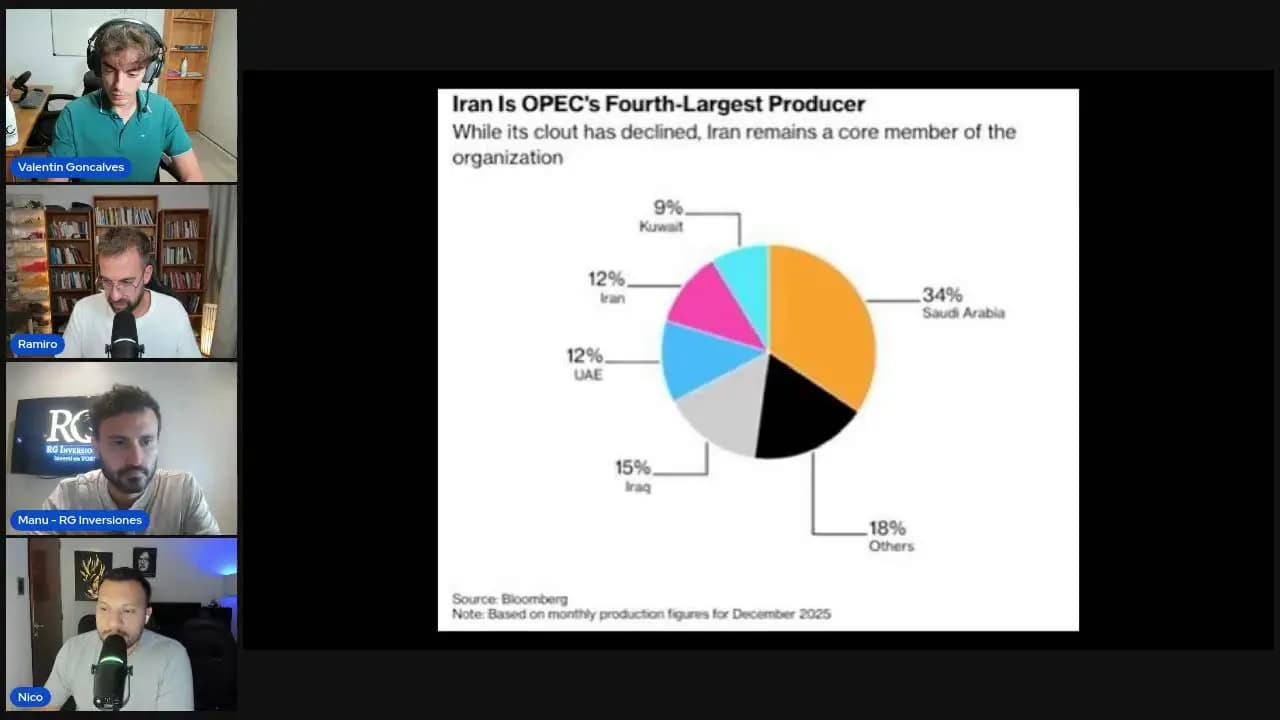
Very good afternoon everyone, how are all the participants who have registered in this webinar about the war in Iran? Our principal host Blas, how are you? Juan, I am very well, expectant. Today is an extremely relevant day because in 20 o'clock United States time—that's 21 hours here in Argentina—Trump's ultimatum ends. There is already a lot of back and forth. Recently, the news that the minister of Pakistan, who is a mediator with Iran, asked the United States to postpone this ultimatum for two weeks. We have to see Trump's answer. Whatever it is, there will be some news, a little more certainty from nine o'clock at night today. Even the betting pages are appreciating this probability of a high fire between the United States and Iran. There's little left.
I can't deny that I saw very little on Twitter a while ago. I saw the closing of the market that surprised me—ended up several assets in green towards the end of today's wheel. I assumed that something in between Trump will be braking, or at least the market is seeing it that way. Since this news came out, we had the typical reaction: oil down, rates down, then all risk assets including metals up. Metals we will talk about later—not during the war have they officiated as a refuge. Apparently, the market is appreciating good news or at least panic mode is not coming with this ultimatum, mainly with the closing of the last minutes. Also the importance Trump gives to the rates that had a nice fall at the end of the wheel.
Idea is to show some assets, some analysis, precisely actions that have been put interesting, show some myths of typical traditional wallets, tell what we do inside the club. If you think we started or you have any comments. I think it's great—it's going to be one of the webinars with a lot of content, but this one in particular they will be able to take advantage because there are concrete things to apply immediately.
Good morning program every Tuesday at 9 a.m. where we connect, answering market doubts of people in the club of CD Pro. I said good, Marcelo will see us in the afternoon—here it is. Thank you Marce. No surgery came out, thanks for coming. Marcelo was also today for the morning.
How are you doing in your portfolios? More liquid or all invested? See it as opportunity or imminent risk? The beauty of the market: someone buys, someone sells; someone optimistic, someone afraid; someone sees opportunity, another threat.
Marcelo says in Argentina it is difficult to win the bid—there are instruments like the new fixed term UVA that pays every month with 4.5% annual performance that covers inflation and you charge a flow every month. Sil says I would like to have more money, we are six. Ariel derived a little more to fixed income. Marcelo seeing it as a lot of risk, exposition reduced, accelerates and passes to fixed income until it passes the storm. Valid and recommended for conservatives—preferable to pay tolls before they all kill each other, then with greater certainty find clearer opportunities at different prices.
Focus not geopolitical analysis but everything derived: oil passes in three dollars, energy actions big winners this year and in March (atypical month where everything fell except energy). United States main market: evaluations for long-term investing—understand what one is paying beyond technical analysis. Gold—many surprised by fall during March war. Argentina market showed relative strength. Examples of wallets vs typical 60/40 portfolio traditional advisors offer, some metrics.
Idea of webinar: bring tranquility, certainties of panorama, lower the foam, concrete things.
Trump tweet today morning: many people can die, he does not want that—typical threats. Understanding Trump method, worst scenario not going to happen, similar to last year aranceles. Nobody can rule out any scenario, but market acts infer base scenario not super major scale. Trump will have answer.
One does not have to guess to invest—one with diary of Friday makes decisions. Miguel's phrase: one does not know future but to invest well not necessary to see future. Be attentive to news tonight—strong movements.
One of main fears of Trump: rate. Trump pressed Fed innumerable times to lower rate. Inflation to a year heated up due to war context; long-term expectations not up much—market believes short-term. Friday inflation data expected to heat short-term. Employment resilient, elections soon. Trump threw good signals to end war when rate high. Now rates at 4.3% on 10-year—critical. Petronas and rate where greatest flow.
Rates at 1, 2, 5, 10, 20 years. Fed interferes short rate, market guides medium/long-term by expectations: productivity, GDP, inflation, deficit—supply/demand of bonds. Last year Fed lowered rates, long rate rose.
Rate up: pressure on bonds (inverse relationship), hits equities (future cash flows discounted at higher rate—hits growth/tech more than defensives), metals (opportunity cost vs gold), all markets.
Dollar: linked to rate. Last year weakness favored gold; recent appreciation hit gold, emerging markets (indebted, commodity-dependent).
Oil future curve in backwardation: spot/may-june at 115-116, december at 74. Market does not believe stretch over time—believes solved, bottleneck short-term. Short contracts strong movement, long little.
XLE: vertical rise this year. Oil price, EV/EBITDA ~8 (high vs previous years). If conflict accentuates, decompression in multiple—fall in energy sector. Like energy long-term, but separate plazos. Short-term risk/return not ideal after parabolic rise.
Morning program members doubted: buy more energy or sell to rotate to tech?
Same conclusion: phenomenal run long-term, fundamentals good, but record-high valuations. Short-term learn from Trump/war; margin of safety reduced because expensive (risk of fall higher, upside limited). Market has good news priced in.
S&P 500 ended positive (neutral, from -0.5%). Distance <6 points from max despite war volatility—relative strength.
S&P 500 price (light blue) vs earnings per share (dark blue): short-term disconnection—price fell strong, businesses/analyst expectations up. Opportunity when fundamentals good, price does not reflect (Buffett: difference price/value).
P/E: average last 5 years (<20x), slightly above 10-year average. More just/fair than 24x three-four months ago. Positive perspectives, greater margin of safety.
No bubble like 2000 dot-com: now aligned prices/fundamentals, no comparison to then.
Sectors: white dots quarterly returns (most red); blue bars change in 12-month earnings consensus; red bar P/E multiple change. S&P: positive earnings change, negative multiple—price fell, business up. Energy: both up—multiples expanded, more expensive.
Opportunities after fear/crisis/volatility—not when all good.
Price/earnings: tech cheaper than consumer staples (market pays more for defensive earnings despite tech double-digit growth vs conservative defensives). Market overreacted—not normal, won't last (e.g., Coca-Cola, McDonald's, Procter & Gamble).
Many concepts technical—explained in club membership Tuesdays in Telegram.
La forma para pasar de ser un apostador a ser inversor es elegir activos y sectores. Luego se puede tener una mirada o análisis distinto, pero son las cosas que uno tiene que mirar o tener alguien que sepa mirándolas para dar una mano y tomar decisiones de inversión. Esto es correcto, no son muchos indicadores fáciles de conseguir, está bueno estar en lugares donde alguien los mire y luego tomar la decisión que se quiera.
Nadie ve el futuro, se trata de tomar decisiones objetivas buscando cosas con sentido, buena relación riesgo-retorno, margen de seguridad, punto de entrada atractivo mirando gráficos, porque es la mejor forma de invertir.
Debe haber sana desconfianza en cualquier indicador, persona o comentario para construir criterio propio, cómodo con los datos o framework, método de trabajo y decisiones. Tener un plan no garantiza ganar plata, pero no tenerlo casi garantiza perder.
El PEG es precio sobre ganancias ajustado por crecimiento esperado. Toma el forward P/E (precio/ganancias esperadas próximos 12 meses) y lo divide por el crecimiento esperado del segundo año. Línea clara: mercado americano; línea oscura: mundo sin EE.UU.
El P/E dice cuánto pagás por cada dólar de ganancia, pero no sobre crecimiento futuro. PEG corrige eso: P/E dividido por crecimiento esperado da foto completa de si está caro o barato. Típicamente, PEG=1 es equilibrio; <1 barato; >1 ya descontó crecimiento.
Limitaciones: depende de expectativas; no útil para cíclicos como petróleo o bancos por amortización/endeudamiento, da señales engañosas. Sirve como punto de partida para mercado general.
EE.UU. comprimió y está con misma valuación que resto del mundo (~1.1-1.2). Históricamente, EE.UU. está ajustado, en promedio últimos 20 años. P/E solo dice un poco caro, pero ajustado por crecimiento no está caro: no es lo mismo 20x ganancias con mucho crecimiento vs. sin crecimiento.
La valuación habla del posible retorno esperado: comprar barato implica rendimientos altos; caro, complicado.
Gráfico Russell 3000 (empresas medianas EE.UU.): eje X P/E, eje Y retorno anualizado siguientes 10 años. Relación inversa clara: P/E 10-11 → 16-20% anual; P/E 18-20 → 6-8% anual. Comprar barato da buenos retornos por margen de seguridad y expectativas.
R²=0.73: 73% variación retornos 10 años explicada por P/E. Poderoso: para ser Warren Buffett, comprar empresas espectaculares a buenos precios. Inversión = empresa + precio pagado.
Gráfico color de guerra (técnico): S&P 500 hace piso en 5-7 meses, suele pesar ~10% al menos históricamente. Piso temprano en tiempos de guerra con máxima incertidumbre, miedo, sobre-reacción. Historia marca piso temprano en últimos eventos.
No predictivo, pero útil. Piden like/comentario si gusta el contenido.
Gráfico oro: corrección tranquila, mensual ni corrigió. Oro no se corrigió mucho. Contexto: conflicto → tasas bajan en recesión (oro sube), pero aquí tensión petróleo → petróleo/tasas arriba, oro no ideal. Momento riesgoso → posiciones en activos líquidos para cubrirse, tras subas monumentales. Corrección fuerte + margin calls + bancos centrales vendieron.
Minera oro: arriba P/E (no ideal); abajo EV/EBITDA (adecuado). Con suba oro, mineras no caras, sino baratas relativo a generación. Siguen gustando metales, porción importante en carteras. Tesis intacta pese a oro >$2000 (margen seguridad distinto).
Escenario mundial impacta Merval. Gente optimista en acciones/bonos argentinos (20-30% cartera), desoptimistas. Argentina beneficiada por energía/commodities. Inversor se aburre si no sube/baja; importante acompañamiento para no errar, plazos determinados.
Membresía Club de Inversores: objetivo sentir acompañados.
No como 2021-2022 (bonos <20, bancos regalados). Ahora no, pero valuaciones atractivas con margen seguridad.
Vista: acción preferida desde 2021 (barata); máximo histórico, valuación exigente → cautos. Obligación en cartera, buenos fundamentos/perspectivas, margen cambió.
Bitcoin: propio partido, marzo estable mientras acciones caían. Largo plazo tiene sentido, comportó diferente.
Tecnología ofrece valuaciones bajas últimos años, margen seguridad. Mercado Libre, Amazon, Google, Nvidia, Microsoft, Meta, Nubank.
Cuadro P/E, crecimiento ganancias 5 años, PEG implícito:
- Nubank y Vista preferidas: enamorado empresa + valuación barata.
- Nubank: mercado convalida versión barata vs. fundamentos (México, Colombia, EE.UU., Brasil). Margen seguridad, premio interesante.
- Otras atractivas: Nvidia (certidumbre sector), Meta, Meli, Amazon, Microsoft; Google más exigente pero atractiva.
Nubank gráfico: precio alinea con ganancias; caída >20% precio pero ganancias crecen (16x projected profits, alto probabilidad). Premio interesante si precio acompaña.
Portfolio típico 60/40 (60% acciones, 40% bonos): estándar décadas, suponía diversificación (acciones suben, bonos cubren crisis). Ya no: tasas no bajan como 80s-2022; 2022 peor año historia (- correlación positiva inflación). Cayó 3.7% marzo.
Carteras club: lógica ajustable. Ejemplo conservadora: caída 4% marzo (vs. 60/40 peor); desvío estándar 5.4 (menos volátil que 7+ de 60/40); 2022: 20.1%; 2023 YTD: +5.5% (vs. 60/40 rojo). 60% bonos (distintos plazos/calidad).
Problemas 60/40:
- Asunción falsa: bonos no siempre refugio.
- Sin diversificación real (solo 2 clases activos, correlacionan corto plazo).
- Pierde rendimientos commodities/energía/metales/activos reales.
Warren Buffett: bastan 2-4 decisiones inteligentes/año + gestión riesgos para años interesantes. 60/40 no desastre, pero ineficiente hoy.
Ejemplos carteras club: conservadora (pocos activos, simple).
La cartera tiene 60% en bonos de diferentes tipos, plazos y calidad crediticia. Luego, exposición en metales como oro y plata, y renta variable con mercados emergentes, S&P 500 (equal weight), energía, Vista, Brasil, China y algo de Bitcoin. Es una cartera muy simple conceptualmente, aunque las que manejamos suelen ser más sofisticadas. En marzo, sufrió porque cayó todo salvo petróleo, y esta cartera no estuvo genoa (caída de 1,94%), algo relativamente tranquilo.
Esta es una cartera relativamente conservadora. La matriz de correlaciones muestra azules claros (correlaciones bajas positivas) o rojos (negativas). Hay que armar un equipo de fútbol: no 11 delanteros iguales, sino arquero, defensores, mediocampistas, delanteros. Buscar activos que se muevan diferente para que, si todo cae, algunos protejan. En marzo cayó todo menos energía, que defendió; caída de 1,9% en vez de 4-7%.
Activos: Polonia, Energía, Uranio, Real Estate, Alibaba, Mercado Libre, Nubank, NVIDIA, Pampa, Vista, YPF, Galicia, Bitcoin. Volatilidad de 7,8%, similar a cartera 60-40 (7,4%). Rendimiento año pasado 31%, este año +5%. Sharpe 2,8 vs. 60-40 Sharpe 0,57, S&P 500 suele 0,60-0,70 con 10% anual histórico, pero caídas intranuales de 14-15%. Esta tuvo Sharpe altísimo difícil de mantener; S&P 500 histórico 0,6-0,7.
Caída de marzo 2,5% (más agresiva), pero acumulado año positivo mientras índices EE.UU. en rojo. Matriz de correlaciones con colores claritos: jugadores distintos, en tendencia alcista, buena evaluación, correlación gestionada.
Se cubrieron portafolios, evaluaciones de mercados, qué observar. Invitación a página (en comentarios) para membresía: carteras actualizadas, preguntas, interacción entre miembros. Encuesta club: 50% cree Trump pospone deadline, 20% escalada fuerte. Precio especial hasta mañana 18 hs. Rentabilizará inversiones rápido.
Garantizo buena información, buen análisis y construir criterio propio. Estando enchufado a la Matrix para entender oportunidades.
Herramientas para seguimiento de mercado. Comentarios casuales sobre Twitter, Boca, fútbol (Libertadores, Sudamericana, DirecTV Go, Flow). Despedida: gracias, sirvió mucho, hasta la próxima. Miembros se ven ahí, no miembros invitados: buena relación riesgo-retorno, evaluación atractiva.
Keep Club de Inversores in your library
Save the videos and channels worth coming back to, and find them again in one place.